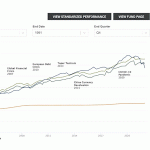
The Merger Fund® Interactive Chart
See how The Merger Fund® can diversify traditional stock and bond portfolios in an interactive way.
Spreads remain very attractive. As of June 30th, we were tracking 143 transactions, with a median annualized spread similar to last months of roughly 12.1%. Both The Merger Fund® and the Virtus Westchester Event-Driven Fund continue to hold arbitrage investments with a weighted median annualized spread in the mid-teens. As a reminder, the funds' net performance will typically be lower than the gross spreads, which would be net of fund expenses, trading and hedging costs, potential time slippage, and the occasional terminated transaction.
| 3 Year | MERIX | WCEIX | WCFIX | Benchmark 1: S&P 500 TR USD | Benchmark 2: Bloomberg US Agg Bond TR USD | Peer Group Average |
|---|---|---|---|---|---|---|
| Total Return | 1.53 | 0.31 | 2.63 | 10.01 | -3.02 | 0.71 |
| Standard Deviation | 2.94 | 4.65 | 3.98 | 17.86 | 7.43 | 4.79 |
| Alpha (vs. S&P 500®) | -2.04 | -4.14 | -1.88 | 0.00 | -8.42 | -3.54 |
| Sharpe Ratio | -0.62 | -0.65 | -0.19 | 0.36 | -0.84 | -0.49 |
| Sortino Ratio | -0.74 | -0.79 | -0.26 | 0.54 | -1.05 | -0.56 |
| Beta (vs. S&P 500®) | 0.03 | 0.15 | 0.15 | 1.00 | 0.29 | 0.13 |
| Correlation | 0.18 | 0.59 | 0.72 | 1.00 | 0.70 | 0.41 |
| Beta (vs. Agg) | 0.04 | 0.24 | 0.27 | 1.70 | 1.00 | 0.19 |
| Correlation (vs. Agg) | 0.10 | 0.39 | 0.53 | 0.70 | 1.00 | 0.24 |
| 5 Year | MERIX | WCEIX | WCFIX | Benchmark 1: S&P 500 TR USD | Benchmark 2: Bloomberg US Agg Bond TR USD | Peer Group Average |
|---|---|---|---|---|---|---|
| Total Return | 3.00 | 3.22 | 6.72 | 15.05 | -0.23 | 3.72 |
| Standard Deviation | 3.03 | 7.73 | 10.59 | 18.08 | 6.23 | 6.90 |
| Alpha (vs. S&P 500®) | -0.30 | -2.74 | 0.16 | 0.00 | -4.78 | -1.50 |
| Sharpe Ratio | 0.22 | 0.11 | 0.41 | 0.69 | -0.40 | 0.22 |
| Sortino Ratio | 0.29 | 0.15 | 0.58 | 1.08 | -0.53 | 0.38 |
| Beta (vs. S&P 500®) | 0.08 | 0.29 | 0.35 | 1.00 | 0.18 | 0.24 |
| Correlation | 0.44 | 0.68 | 0.59 | 1.00 | 0.53 | 0.57 |
| Beta (vs. Agg) | 0.09 | 0.32 | 0.40 | 1.54 | 1.00 | 0.29 |
| Correlation (vs. Agg) | 0.19 | 0.26 | 0.23 | 0.53 | 1.00 | 0.25 |
| 10 Year | MERIX | WCEIX | WCFIX | Benchmark 1: S&P 500 TR USD | Benchmark 2: Bloomberg US Agg Bond TR USD | Peer Group Average |
|---|---|---|---|---|---|---|
| Total Return | 2.92 | 3.15 | NA | 12.86 | 1.35 | 2.78 |
| Standard Deviation | 3.00 | 6.18 | NA | 15.31 | 4.87 | 6.31 |
| Alpha (vs. S&P 500®) | 0.29 | -1.51 | NA | 0.00 | -1.53 | -1.41 |
| Sharpe Ratio | 0.43 | 0.24 | NA | 0.72 | -0.05 | 0.18 |
| Sortino Ratio | 0.62 | 0.33 | NA | 1.13 | -0.07 | 0.26 |
| Beta (vs. S&P 500®) | 0.09 | 0.27 | NA | 1.00 | 0.12 | 0.24 |
| Correlation | 0.45 | 0.68 | NA | 1.00 | 0.37 | 0.56 |
| Beta (vs. Agg) | 0.06 | 0.25 | NA | 1.17 | 1.00 | 0.21 |
| Correlation (vs. Agg) | 0.09 | 0.19 | NA | 0.37 | 1.00 | 0.17 |
| Product / Market Indices | Ticker | MTD | YTD | 1 Year | 2 Year | 3 Year | 5 Year | 10 Year |
|---|---|---|---|---|---|---|---|---|
| Westchester Event-Driven | WCEIX* | 0.47 | 0.28 | 5.95 | 4.57 | 0.31 | 3.22 | 3.15 |
| Westchester Credit Event | WCFIX* | 0.80 | 3.38 | 7.89 | 8.38 | 2.63 | 6.72 | NA |
| The Merger Fund® | MERIX* | 0.59 | 0.65 | 6.21 | 3.86 | 1.53 | 3.00 | 2.92 |
| S&P 500® Index | 3.59 | 15.29 | 24.56 | 22.05 | 10.01 | 15.05 | 12.86 | |
| Bloomberg U.S. Aggregate Bond Index | 0.95 | -0.71 | 2.63 | 0.83 | -3.02 | -0.23 | 1.35 |
* MERIX inception date is 8/1/13 (The Merger Fund® A Shares inception date is 1/31/89), WCEIX inception date is 1/2/14, WCFIX inception date is 10/29/17.
Performance data quoted represents past results. Past performance is no guarantee of future results, and current performance may be higher or lower than the performance shown. Investment return and principal value will fluctuate, so your shares, when redeemed, may be worth more or less than their original cost.
Class I shares have no sales charges and are not available to all investors. Other share classes have sales charges. The Merger Fund® - The fund class gross expense ratio is 1.37%. The net expense ratio is 1.27%, which reflects a contractual expense reimbursement in effect through 04/30/2025. The net expense ratio minus dividend and interest expense on short sales and indirect expenses incurred by the underlying funds in which the Fund invests is 1.17%. Virtus Westchester Credit Event Fund - The fund class gross expense ratio is 1.61%. The gross expense ratio minus dividend and interest expenses on short sales and indirect expenses incurred by the underlying funds in which the Fund invests is 1.45%. Virtus Westchester Event Driven Fund - The fund class gross expense ratio is 1.67%. The net expense ratio is 1.57%, which reflects a contractual expense reimbursement in effect through 04/30/2025. The net expense ratio minus dividend and interest expenses on short sales is 1.53%.
All investments carry a certain degree of risk, including possible loss of principal.
IMPORTANT RISK CONSIDERATIONS
The Merger® Fund: 3, 8, 12, 13, 4, 9, 1, 2, 5, 14, 11, 7, 10; Virtus Westchester Event-Driven Fund: 3, 8, 4, 12, 9, 1, 2, 5, 13, 7, 10; Virtus Westchester Credit Event Fund: 3, 8, 1, 12, 9, 2, 5, 6, 4, 13, 7, 10.
GLOSSARY
Alpha: A risk-adjusted measure of an investment’s excess return relative to a benchmark. Beta: A quantitative measure of the volatility, or systematic risk, of a security or a portfolio in comparison to the market as a whole. Correlation: A measure that determines the degree to which two variables’ movements are associated. The correlation coefficient will vary from -1 to +1. A -1 indicates perfect negative correlation and +1 indicates perfect positive correlation. Long Position: Refers to the purchase of a security with the expectation that it will rise in value. Deal Spreads: The difference between what the buyer (acquirer) is offering in terms of price for the seller’s (target) stock, typically at a premium to the market price, the result of some risk of the transaction being delayed or terminated. Long Position: Refers to the purchase of a security with the expectation that it will rise in value. Maximum Drawdown: The peak-to-trough decline during a specific record period of an investment, fund, or commodity. A drawdown is usually quoted as the percentage between the peak and the trough. Sharpe Ratio: A risk-adjusted measure calculated using standard deviation and excess return to determine reward per unit of risk. Short Position: Refers to the sale of a borrowed security with the intention of buying it back later at a lower price. Standard Deviation: Measures variability of returns around the average return for an investment portfolio. Higher standard deviation suggests greater risk.
INDEX DEFINITIONS
The Bloomberg U.S. Aggregate Bond Index measures the U.S. investment grade fixed rate bond market. The Morningstar U.S. Fund Event Driven Category Average contains strategies that attempt to profit when security prices change in response to certain corporate actions, such as bankruptcies, mergers and acquisitions, emergence from bankruptcy, shifts in corporate strategy, and other atypical events. Activist shareholder and distressed investment strategies also fall into this category. These portfolios typically focus on equity securities but can invest across the capital structure. The category average is calculated on a total return basis with dividends reinvested. The category average is unmanaged and is not available for direct investment. The S&P 500® Index is a free-float market capitalization-weighted index of 500 of the largest U.S. companies. Indexes are calculated on a total return basis. Indexes are unmanaged, their returns do not reflect any fees, expenses, or sales charges, and are not available for direct investment.
Please consider a Fund’s investment objectives, risks, charges, and expenses carefully before investing. For this and other information about any Virtus Fund, contact your financial representative, call 800-243-4361, or visit virtus.com for a prospectus or summary prospectus. Read it carefully before investing.
Not insured by FDIC/NCUSIF or any federal government agency. No bank guarantee. Not a deposit. May lose value.
Distributed by VP Distributors, LLC member FINRA and subsidiary of Virtus Investment Partners, Inc.