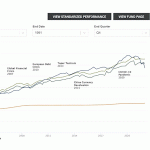
The Merger Fund® Interactive Chart
See how The Merger Fund® can diversify traditional stock and bond portfolios in an interactive way.
The Merger Fund®
The Fund seeks to deliver consistent, positive absolute returns with lower volatility to traditional stocks by investing in publicly announced mergers, acquisitions, takeovers, and other corporate reorganizations globally. The highly specialized team seeks to profit from the timely completion of corporate transactions with minimal correlation to traditional stocks and bonds and positive correlation to interest rates, all while striving to minimize drawdowns in volatile markets.
Westchester Capital Management (Westchester) is an event-driven alternatives manager that, for over 40 years, has endeavored to deliver consistent, absolute returns through disciplined execution.

Co-President and Co-Chief Investment Officer
Industry start date: 1987
Start date as fund Portfolio Manager: 2007

Co-President and Co-Chief Investment Officer
Industry start date: 1988
Start date as fund Portfolio Manager: 2007
Merger arbitrage strategies have historically provided attractive absolute returns with lower volatility and minimal correlation relative to traditional stock and bond strategies, making for a powerful portfolio diversifier.
The Merger Fund® was the first mutual fund devoted exclusively to merger arbitrage, offering access to an alternative strategy in a regulated, transparent, and daily liquidity fund that has provided investors positive performance in 30 of 34 years since its inception in 1989.*
A leader in global event driven investing for over 30 years, Westchester has evaluated more than 10,000 announced transactions, and invested in over 5,000 mergers, acquisitions, and corporate reorganizations, of which more than 98% were completed.
The track record refers to the original share class of the Fund, which was known as Investor Class at the time and is now known as Class A, from inception of 1/31/89 until inception on 8/1/13 of the Institutional Class which is now known as Class I. Returns would differ only to the extent that Class I shares do not have the same expenses as Class A shares.
| Average position size | 1.56% |
| Number of long positions(1) | 60 |
| Number of short positions(1) | 12 |
| Percent Invested | 93.84% |
| Short positions as a % of net assets | 29.95% |
(1) It is important to note that long positions, net of short positions ("Net Exposure"), is not an accurate indicator of the Fund's directional exposure and has limited informational value. The Fund's Net Exposure is dependent upon the structure and consideration paid to the target company in each of our investments. A portfolio with a greater concentration of cash deals, for example, will have a higher Net Exposure calculation than a portfolio composed primarily of stock - for - stock transactions, yet both portfolios will have the same level of market correlation, or directional exposure. Our positions are typically fully hedged to neutralize such exposure, in order to minimize equity market correlation and volatility.
| Pioneer Natural Resources Company | |
| Hess Corporation | |
| WestRock Company | |
| United States Steel Corporation | |
| NFP Corp. | |
| Virtus Westchester Event-Driven Fund | |
| Amedisys, Inc. | |
| Capri Holdings Limited | |
| Juniper Networks, Inc. | |
| Catalent, Inc. | |
| Top 10 Positions as % of Fund | 40.88% |
Deal terms, regional exposure, sector exposure, and top positions are subject to change.
Deal terms reflect the classification of the type of transaction. Cash reflects an all-cash proposal by one company to buy another’s outstanding shares; cash and stock involves a cash proposal and additional stock in the acquiring company; stock with a fixed exchange ratio refers to a strategy whereby the acquired company safeguards itself from fluctuation in share prices; stock with stub represents remaining equity left over after a company converts its bonds to stub stocks because of the takeover or bankruptcy; and risk reversal is a hedging strategy that protects a long or short position by using put and call options. *The compensation is undetermined because the compensation to be received (e.g., stock, cash, escrow notes, other) will be determined at a later date, potentially at the option of the Fund's investment adviser.
| Energy | |
| Health Care | |
| Materials | |
| Financials | |
| Consumer Discretionary | |
| Information Technology | |
| Industrials | |
| Consumer Staples | |
| Communication Services | |
| Utilities | |
| Real Estate |
| United States | |
| United Kingdom | |
| Japan | |
| Europe ex-U.K. | |
| North America Offshore | |
| Australia | |
| Canada | |
| Asia ex-Japan | |
| Mexico |
Performance data quoted represents past results. Past performance is no guarantee of future results and current performance may be higher or lower than the performance shown. Investment return and principal value will fluctuate, so your shares, when redeemed, may be worth more or less than their original cost.
The Index shown represents the Fund's performance index, which may differ from the Fund's regulatory index included in the Fund's Prospectus.
| Fund | Index | |
|---|---|---|
| R2 | ||
| Beta | ||
| Alpha | ||
| Std Dev |
| An Introduction to Merger Arbitrage | |
| Delivering Liquid Alts in Traditional Portfolio | |
| Morningstar Report: The Merger Fund® (MERIX) | |
| Westchester Investment Solutions At-A-Glance | |
| Correlations, Inflation, and Interest Rates | |
| Virtus Alternative Funds Menu |
Investors should carefully consider the investment objectives, risks, charges and expenses of any Virtus Mutual Fund before investing. The prospectus and summary prospectus contains this and other information about the fund. Please contact your financial representative, call 1-800-243-4361 to obtain a current prospectus and/or summary prospectus. You should read the prospectus and/or summary prospectus carefully before you invest or send money.
Performance data quoted represents past results. Past performance is no guarantee of future results and current performance may be higher or lower than the performance shown. Investment return and principal value will fluctuate, so your shares, when redeemed, may be worth more or less than their original cost.
Average annual total return is the annual compound return for the indicated period. It reflects the change in share price and the reinvestment of all dividends and capital gains. NAV returns do not include the effect of any applicable sales charges. POP and w/CDSC returns include the effect of maximum applicable sales charges.
Returns for periods of less than one year are cumulative total returns.
1 Yields/Distributions: 30-day SEC Yield is a standardized yield calculated according to a formula set by the SEC, and is subject to change. 30-day SEC Yield (unsubsidized) is the 30-day SEC Yield without the effect of applicable expense waivers. Distribution Rate is calculated by (a) annualizing the latest income distribution for fixed income funds or funds less than 1 year old, or (b) summing all income distributions over the preceding 12 months for all other funds, and dividing the NAV on the last business date of the period, unless otherwise indicated. The Distribution Rate may be comprised of ordinary income, net realized capital gains and returns of capital.
2 Distribution History: Distributions are represented on a cash basis and may be reclassified at year end for tax purposes. The Fund will send you a Form 1099-DIV for the calendar year that will tell you how to report these distributions for federal income tax purposes. STCG: Short Term Capital Gain, LTCG: Long Term Capital Gain
3 Risk Statistics: R2 is a statistical measure that represents the percentage of a fund or security's movements that can be explained by movements in a benchmark index. Beta is a quantitative measure of the volatility of a given portfolio to the overall market. Alpha is a risk adjusted measure of an investment's excess return relative to a benchmark. A positive Alpha indicates that the investment produced a return greater than expected for the risk (as measured by Beta) taken. Standard Deviation measures variability of returns around the average return for an investment fund. Higher standard deviation suggests greater risk. Risk Statistics are calculated using 36 monthly returns.
4 Characteristics: For Equity Funds: Avg. Weighted Market Cap (bn): The sum of each security's weight within the fund (or index) multiplied by the security's market capitalization. Trailing P/E Ex-Negative Earnings: Per-share stock price divided by the latest 12-months Earnings per Share; Price/Cash Flow: Per-share stock price divided by the per-share operating cash flow; Price/Book: Per-share stock price divided by the latest 12-month per-share Book Value; 3-Year EPS Growth Rate: Average of earnings per share growth for latest 3-year period. The 3-Year EPS Growth Rate is not a forecast of the fund's performance.
4 Characteristics: For Fixed Income Funds: Effective Duration represents the interest rate sensitivity of a fixed income fund. For example, if a fund's effective duration is five years, a 1% increase in interest rates would result in a 5% decline in the fund's price. Similarly, a 1% decline in interest rates would result in a 5% gain in the fund's price.
Morningstar Disclosures:
The Morningstar Rating™ for funds, or "star rating", is calculated for managed products (including mutual funds, variable annuity and variable life subaccounts, exchange-traded funds, closed-end funds, and separate accounts) with at least a three-year history. Exchange-traded funds and open-ended mutual funds are considered a single population for comparative purposes. It is calculated based on a Morningstar Risk-Adjusted Return measure that accounts for variation in a managed product's monthly excess performance, placing more emphasis on downward variations and rewarding consistent performance. The top 10% of products in each product category receive 5 stars, the next 22.5% receive 4 stars, the next 35% receive 3 stars, the next 22.5% receive 2 stars, and the bottom 10% receive 1 star. The Overall Morningstar Rating for a managed product is derived from a weighted average of the performance figures associated with its three-, five-, and 10-year (if applicable) Morningstar Rating metrics. The weights are: 100% three-year rating for 36-59 months of total returns, 60% five-year rating/40% three-year rating for 60-119 months of total returns, and 50% 10-year rating/30% five-year rating/20% three-year rating for 120 or more months of total returns. While the 10-year overall star rating formula seems to give the most weight to the 10-year period, the most recent three-year period actually has the greatest impact because it is included in all three rating periods. Ratings do not take into account the effects of sales charges and loads.
© year Morningstar, Inc. All rights reserved. The information contained herein: (1) is proprietary to Morningstar and/or its content providers; (2) may not be copied or distributed; and (3) is not warranted to be accurate, complete, or timely. Neither Morningstar nor its content providers are responsible for any damages or losses arising from any use of this information. Past performance is no guarantee of future results.