Virtus Newfleet Short Duration High Yield Bond ETF
Investment Overview
The Fund actively invests in short term, below-investment grade bonds, seeking to generate both high current income and capital growth. Rigorous credit analysis and a relative value approach, coupled with opportunistic trading, strives to take advantage of mispricings, market dislocations, and other special situations.
Effective November 28, 2023, this Fund's name, ticker, and investment opportunity have changed.
Income Insights
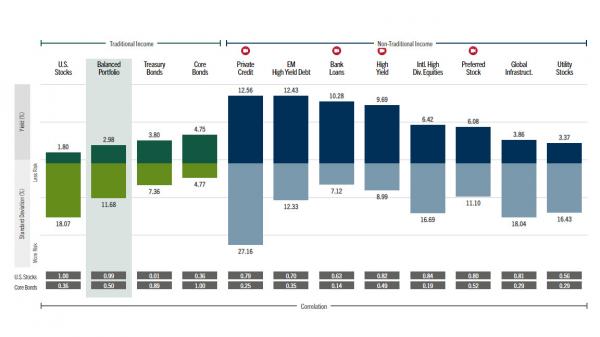
Get market insight on non-traditional income producing asset classes in an interactive way.
Investment Partner
Newfleet Asset Management
Newfleet Asset Management leverages the knowledge and skill of a team of investment professionals with expertise in every sector of the bond market, including evolving, specialized, and out-of-favor sectors. The team employs active sector rotation and disciplined risk management to portfolio construction.
Newfleet Asset Management is a division of Virtus Fixed Income Advisers, LLC ("VFIA"), an SEC registered investment adviser.
Learn more about Newfleet Asset Management
Investment Professionals

David L. Albrycht, CFA
President and Chief Investment Officer
Industry start date: 1985
Start date as fund Portfolio Manager: 2016

William Eastwood, CFA
Senior Managing Director, Portfolio Manager, and Head of Trading
Industry start date: 1995
Start date as fund Portfolio Manager: 2019

Eric Hess, CFA
Senior Managing Director, Portfolio Manager, and High Yield Sector Head
Industry start date: 2006
Start date as fund Portfolio Manager: 2019
Key Features
Higher-Quality High Yield and Shorter Duration
Seeks to manage interest rate risk and minimize volatility by investing in higher-quality high yield bonds with a duration of less than three years
Extensive Fundamental Research
Security selection driven by relative value analysis of individual bond quality, credit risk, valuation, company management, structure, and technical elements
Experienced Credit Management Team
Dedicated team of short-duration fixed income managers who have a strong history of achieving attractive risk-adjusted returns
Top Holdings (% Fund)
| Security | |
|---|---|
| FORD MOTOR COMPANY 3.250 02/12/2032 | |
| TEVA PHARMACEUTICALS NE 3.150 10/01/2026 | |
| ENERGY TRANSFER LP 6.500 11/15/2170 | |
| LSB INDUSTRIES 6.250 10/15/2028 | |
| LADDER CAP FIN LLLP/CORP 4.250 02/01/2027 | |
| WEEKLEY HOMES LLC/ FINAN 4.875 09/15/2028 | |
| GRAY TELEVISION INC 7.000 05/15/2027 | |
| VIASAT INC 5.625 09/15/2025 | |
| CORONADO FINANCE PTY LTD 10.750 05/15/2026 | |
| NEW ENTERPRISE STONE & L 9.750 07/15/2028 |
Performance
Performance data quoted represents past results. Past performance is no guarantee of future results and current performance may be higher or lower than the performance shown. Investment return and principal value will fluctuate, so your shares, when redeemed, may be worth more or less than their original cost.
The Index shown represents the Fund's performance index, which may differ from the Fund's regulatory index included in the Fund's Prospectus.
Fees & Expenses
| Total Expense Ratio | 0.40 |
Yields / Distribution Rate1
(as of 03/28/2024)| 30-day SEC Yield | 8.25 |
| Distribution Rate (as of 04/24/2024) | 8.00 |
Distribution History2
| Ex-Date | Record Date | Payable Date | Dividend Income | ST Capital Gains | LT Capital Gains | Distribution Total |
|---|---|---|---|---|---|---|
| 05/22/2023 | 05/23/2023 | 05/31/2023 | 0.130480 | 0.000000 | 0.000000 | 0.130480 |
| 06/20/2023 | 06/21/2023 | 06/28/2023 | 0.118710 | 0.000000 | 0.000000 | 0.118710 |
| 07/20/2023 | 07/21/2023 | 07/28/2023 | 0.122680 | 0.000000 | 0.000000 | 0.122680 |
| 08/21/2023 | 08/22/2023 | 08/29/2023 | 0.105460 | 0.000000 | 0.000000 | 0.105460 |
| 09/20/2023 | 09/21/2023 | 09/28/2023 | 0.160220 | 0.000000 | 0.000000 | 0.160220 |
| 10/20/2023 | 10/23/2023 | 10/30/2023 | 0.132690 | 0.000000 | 0.000000 | 0.132690 |
| 11/20/2023 | 11/21/2023 | 11/29/2023 | 0.136950 | 0.000000 | 0.000000 | 0.136950 |
| 12/20/2023 | 12/21/2023 | 12/29/2023 | 0.291690 | 0.000000 | 0.000000 | 0.291690 |
| 01/22/2024 | 01/23/2024 | 01/30/2024 | 0.010000 | 0.000000 | 0.000000 | 0.010000 |
| 02/21/2024 | 02/22/2024 | 02/29/2024 | 0.107060 | 0.000000 | 0.000000 | 0.107060 |
| 03/20/2024 | 03/21/2024 | 03/26/2024 | 0.121570 | 0.000000 | 0.000000 | 0.121570 |
| 04/22/2024 | 04/23/2024 | 04/29/2024 | 0.141310 | 0.000000 | 0.000000 | 0.141310 |
Premium/Discount
| Period | Number of Days Fund has Traded at a: | |||||||||
|---|---|---|---|---|---|---|---|---|---|---|
| Discount | Premium | |||||||||
| Less than -2% | -1.51% to -2.00% | -1.01% to -1.50% | -0.51% to -1.00% | -0.01% to -0.50% | 0.00% to 0.50% | 0.51% to 1.00% | 1.01% to 1.50% | 1.51% to 2.00% | Greater than 2% | |
| 2022-Q2: 4/1/2022 through 6/30/2022 | 0 | 0 | 0 | 0 | 56 | 5 | 1 | 0 | 0 | 0 |
| 2022-Q3: 7/1/2022 through 9/30/2022 | 0 | 0 | 0 | 8 | 41 | 13 | 2 | 0 | 0 | 0 |
| 2022-Q4: 10/3/2022 through 12/30/2022 | 0 | 0 | 0 | 22 | 26 | 15 | 0 | 0 | 0 | 0 |
| 2023-Q1: 1/3/2023 through 3/31/2023 | 0 | 0 | 0 | 32 | 20 | 10 | 0 | 0 | 0 | 0 |
| 2023-Q2: 4/3/2023 through 6/30/2023 | 0 | 0 | 0 | 1 | 54 | 7 | 0 | 0 | 0 | 0 |
| 2023-Q3: 7/3/2023 through 9/29/2023 | 0 | 0 | 0 | 0 | 60 | 3 | 0 | 0 | 0 | 0 |
| 2023-Q4: 10/2/2023 through 12/29/2023 | 0 | 0 | 0 | 1 | 45 | 16 | 0 | 0 | 0 | 1 |
| 2024-Q1: 1/2/2024 through 3/28/2024 | 0 | 0 | 0 | 0 | 43 | 18 | 0 | 0 | 0 | 0 |
Risk Considerations
Marketing Materials
| Newfleet Fixed Income Fund Capabilities | |
| ETF Product Guide | |
| Virtus ETF Ticker Menu | |
| It Might Be Time to Consider Short Duration High Yield | |
| Spotlight on Global Credit | |
| Newfleet 2024 Fixed Income Market Outlook | |
| The Case for Short Duration High Income |
Positions
Please consider the investment objectives, risks, charges and expenses of the Fund carefully before investing. The prospectus contains this and other information about the Fund. Contact us at 1-888-383-0553 or visit www.virtus.com for a copy of the Fund's prospectus. Read the prospectus carefully before you invest or send money.
The Fund is an actively managed exchange-traded fund (“ETF”) and does not seek to replicate the performance of a specified index. The Fund may have a higher portfolio turnover than funds that seek to replicate the performance of an index.
Performance data quoted represents past results. Past performance is no guarantee of future results and current performance may be higher or lower than the performance shown. Investment return and principal value will fluctuate so your shares, when redeemed, may be worth more or less than their original cost.
Closing Price: The Closing Price is the price of the last reported trade on the fund's primary exchange. If there has been no reported trade for a particular date, the Closing Price represents the 4PM Bid/Offer Midpoint.
4PM Bid/Offer Midpoint: The midpoint between the highest bid and the lowest offer on the listing exchange, as of the time that the Fund's NAV is calculated (usually 4:00pm Eastern Time).
Premium/Discount: The amount the Fund is trading above or below the reported NAV (based on 4PM Bid/Offer Midpoint).
The Fund is an exchange-traded fund (“ETF”). The “net asset value” (NAV) of the Fund is determined at the close of each business day, and represents the dollar value of one share of the Fund; it is calculated by taking the total assets of the Fund, subtracting total liabilities, and dividing by the total number of shares outstanding. The NAV of the Fund is not necessarily the same as its intraday trading value. Fund investors should not expect to buy or sell shares at NAV because shares of ETFs such as the Fund are bought and sold at market price (not NAV) and are not individually redeemed from the Fund. Thus, shares may trade at a premium or discount to their NAV in the secondary market. Brokerage commissions will reduce returns.
NAV returns are calculated using the Fund’s daily 4:00 p.m. NAV, and include the reinvestment of all dividends and other distributions (reinvested at the Fund's NAV on distribution ex-date). Market price returns are calculated using the 4:00 pm midpoint between the bid and offer, and include the reinvestment of all dividends and other distributions (reinvested at the 4:00pm bid/offer midpoint on distribution ex-date). Market price returns do not represent the return you would receive if you traded at other times.
1 Yields/Distributions: 30-day SEC Yield is a standardized yield calculated according to a formula set by the SEC, and is subject to change. 30-day SEC Yield (unsubsidized) is the 30-day SEC Yield without the effect of applicable expense waivers. Distribution Rate is the annual rate that an investor would receive if the most recent distribution remained the same going forward. The rate represents a single distribution from the Fund and does not represent total return of the Fund. The distribution rate is calculated by annualizing the most recent distribution and dividing it by the most recent NAV.
2 Distribution History: Distributions are represented on a cash basis and may be reclassified at year end for tax purposes. The Fund will send you a Form 1099-DIV for the calendar year that will tell you how to report these distributions for federal income tax purposes. STCG: Short Term Capital Gain, LTCG: Long Term Capital Gain
Returns for periods of less than one year are cumulative total returns.
Not insured by FDIC/NCUSIF or any federal government agency. No bank guarantee. Not a deposit. May lose value.