Income Insights
Get market insight on non-traditional income producing asset classes in an interactive way.
Virtus Private Credit Strategy ETF
The Fund strives to deliver an alternative source of yield to traditional fixed income by focusing on the private credit market. The Fund seeks to track the Indxx Private Credit Index, which provides passive exposure to listed instruments that emphasize private credit, including business development companies (BDCs) and closed-end funds (CEFs).
Founded in 2005, with offices in New York, Prague, and New Delhi, Indxx endeavors to deliver innovative and custom indexing solutions to the investment management community at large. Indxx has three dozen ETFs worldwide tracking its indexes, and calculates hundreds of indexes for clients around the globe.
Indxx is the index provider to the Fund. The portfolio managers are affiliated with Virtus ETF Advisers, LLC, the Fund's adviser.

Portfolio Manager, Virtus ETF Advisers LLC
Industry start date: 1988

Executive Managing Director, Chief Operating Officer, Virtus ETF Solutions
Portfolio Manager, Virtus ETF Advisers LLC
Industry start date: 1999
Provides passive exposure to the private credit market of a growing financing market for small- and mid-sized businesses in the United States
An attractive and complementary income opportunity
Quarterly distributions via a portfolio of exchange-traded BDCs and CEFs with significant exposure to private credit instruments such as collateralized loan obligations (CLOs), mezzanine loans, and bank loans
| Security | |
|---|---|
| OXFORD LANE CAPITAL CORP | |
| TRIPLEPOINT VENTURE GROWTH B | |
| XAI OCTAGON FLTNG RT & ALT | |
| FS KKR CAPITAL CORP | |
| PROSPECT CAPITAL CORP | |
| BLACKROCK TCP CAPITAL CORP | |
| GOLDMAN SACHS BDC INC | |
| HORIZON TECHNOLOGY FINANCE C | |
| BLACKROCK INNOV & GRW TRM TR | |
| RUNWAY GROWTH FINANCE CORP |
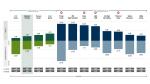
Performance data quoted represents past results. Past performance is no guarantee of future results and current performance may be higher or lower than the performance shown. Investment return and principal value will fluctuate, so your shares, when redeemed, may be worth more or less than their original cost.
The Index shown represents the Fund's performance index, which may differ from the Fund's regulatory index included in the Fund's Prospectus.
| Management Fee | 0.75 |
| Acquired Fund Fees & Expenses | 8.97 |
| Total Expense Ratio | 9.72 |
| 30-day SEC Yield | 11.11 |
| Distribution Rate (as of 07/25/2024) | 8.91 |
| Ex-Date | Record Date | Payable Date | Dividend Income | ST Capital Gains | LT Capital Gains | Distribution Total |
|---|---|---|---|---|---|---|
| 09/20/2023 | 09/21/2023 | 09/28/2023 | 0.537400 | 0.000000 | 0.000000 | 0.537400 |
| 12/20/2023 | 12/21/2023 | 12/29/2023 | 0.764480 | 0.000000 | 0.000000 | 0.764480 |
| 03/20/2024 | 03/21/2024 | 03/26/2024 | 0.510000 | 0.000000 | 0.000000 | 0.510000 |
| 06/20/2024 | 06/20/2024 | 06/27/2024 | 0.510000 | 0.000000 | 0.000000 | 0.510000 |
| Period | Number of Days Fund has Traded at a: | |||||||||
|---|---|---|---|---|---|---|---|---|---|---|
| Discount | Premium | |||||||||
| Less than -2% | -1.51% to -2.00% | -1.01% to -1.50% | -0.51% to -1.00% | -0.01% to -0.50% | 0.00% to 0.50% | 0.51% to 1.00% | 1.01% to 1.50% | 1.51% to 2.00% | Greater than 2% | |
| 2022-Q3: 7/1/2022 through 9/30/2022 | 0 | 0 | 0 | 0 | 39 | 25 | 0 | 0 | 0 | 0 |
| 2022-Q4: 10/3/2022 through 12/30/2022 | 0 | 0 | 0 | 0 | 47 | 16 | 0 | 0 | 0 | 0 |
| 2023-Q1: 1/3/2023 through 3/31/2023 | 0 | 0 | 0 | 0 | 34 | 24 | 4 | 0 | 0 | 0 |
| 2023-Q2: 4/3/2023 through 6/30/2023 | 0 | 0 | 0 | 0 | 27 | 34 | 0 | 0 | 1 | 0 |
| 2023-Q3: 7/3/2023 through 9/29/2023 | 0 | 0 | 0 | 0 | 5 | 56 | 1 | 0 | 1 | 0 |
| 2023-Q4: 10/2/2023 through 12/29/2023 | 1 | 0 | 0 | 0 | 33 | 26 | 2 | 1 | 0 | 0 |
| 2024-Q1: 1/2/2024 through 3/28/2024 | 0 | 0 | 0 | 0 | 5 | 54 | 2 | 0 | 0 | 0 |
| 2024-Q2: 4/1/2024 through 6/28/2024 | 0 | 0 | 0 | 0 | 14 | 49 | 0 | 0 | 0 | 0 |
Please consider the investment objectives, risks, charges and expenses of the Fund carefully before investing. The prospectus contains this and other information about the Fund. Contact us at 1-888-383-0553 or visit www.virtus.com for a copy of the Fund's prospectus. Read the prospectus carefully before you invest or send money.
Performance data quoted represents past results. Past performance is no guarantee of future results and current performance may be higher or lower than the performance shown. Investment return and principal value will fluctuate so your shares, when redeemed, may be worth more or less than their original cost.
Closing Price: The Closing Price is the price of the last reported trade on the fund's primary exchange. If there has been no reported trade for a particular date, the Closing Price represents the 4PM Bid/Offer Midpoint.
4PM Bid/Offer Midpoint: The midpoint between the highest bid and the lowest offer on the listing exchange, as of the time that the Fund's NAV is calculated (usually 4:00pm Eastern Time).
Premium/Discount: The amount the Fund is trading above or below the reported NAV (based on 4PM Bid/Offer Midpoint).
The Fund is an exchange-traded fund (“ETF”). The “net asset value” (NAV) of the Fund is determined at the close of each business day, and represents the dollar value of one share of the Fund; it is calculated by taking the total assets of the Fund, subtracting total liabilities, and dividing by the total number of shares outstanding. The NAV of the Fund is not necessarily the same as its intraday trading value. Fund investors should not expect to buy or sell shares at NAV because shares of ETFs such as the Fund are bought and sold at market price (not NAV) and are not individually redeemed from the Fund. Thus, shares may trade at a premium or discount to their NAV in the secondary market. Brokerage commissions will reduce returns.
NAV returns are calculated using the Fund’s daily 4:00 p.m. NAV, and include the reinvestment of all dividends and other distributions (reinvested at the Fund's NAV on distribution ex-date). Market price returns are calculated using the 4:00 pm midpoint between the bid and offer, and include the reinvestment of all dividends and other distributions (reinvested at the 4:00pm bid/offer midpoint on distribution ex-date). Market price returns do not represent the return you would receive if you traded at other times.
1 Yields/Distributions: 30-day SEC Yield is a standardized yield calculated according to a formula set by the SEC, and is subject to change. 30-day SEC Yield (unsubsidized) is the 30-day SEC Yield without the effect of applicable expense waivers. Distribution Rate is the annual rate that an investor would receive if the most recent distribution remained the same going forward. The rate represents a single distribution from the Fund and does not represent total return of the Fund. The distribution rate is calculated by annualizing the most recent distribution and dividing it by the most recent NAV.
2 Distribution History: Distributions are represented on a cash basis and may be reclassified at year end for tax purposes. The Fund will send you a Form 1099-DIV for the calendar year that will tell you how to report these distributions for federal income tax purposes. STCG: Short Term Capital Gain, LTCG: Long Term Capital Gain
Returns for periods of less than one year are cumulative total returns.
Not insured by FDIC/NCUSIF or any federal government agency. No bank guarantee. Not a deposit. May lose value.
