By Ben Carlson
A Wealth of Common Sense
I love studying historical market returns. Looking at market history is never going to help you predict the future, but it can help you better understand the way the stock market generally functions.
For instance, looking at annual returns in the stock market won’t tell you what happens next year, but it can help you prepare for a range of outcomes to set something of a baseline.
One of my all-time favorite market stats is the fact that the U.S. stock market has had more 20% up years than negative years since the 1920s. It’s true.
Since 1928, there have been 34 calendar years1 where the S&P 500 has finished up 20% or more against 26 total down years.2
This means the stock market has been up 20% or more 36% of the time and down 27% of all years. That’s a pretty good trade-off, especially when you consider the average down year is a loss of ~13%.
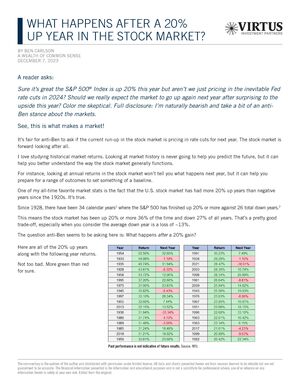
1Not including 2023…yet.
2There have been just six down years of 20% or worse losses.
The commentary is the opinion of the author and distributed with permission under limited license. All data and charts presented herein are from sources deemed to be reliable but are not guaranteed to be accurate. The financial information presented is for information and educational purposes and is not a substitute for professional advice; use of or reliance on any information herein is solely at your own risk. Edited from the original.